The United States has been building land since before it was a country. What it has not done is build continuously. The projects below span two centuries and several methods. Taken together they show a pattern: episodic execution, extraordinary speed when it happens, and long-term liabilities consistently unpriced at project inception.
These cases are the US half of the precedent record. The global half is in global-precedents. Value-capture structures appear in economics-and-value-capture. Permitting is in institutions-and-permitting.
Back Bay, Boston (1857-1900)
Before filling, Back Bay was a shallow tidal estuary west of the Shawmut Peninsula, separated from the Charles River by a mill dam constructed in 1818 to 1821. The dam captured tidal power that was never commercially viable, and it stopped tidal circulation. By the 1840s the basin was receiving Boston’s sewage without flushing. Two railroad causeways crossed it in an X pattern, further choking flow. The area was a documented public health problem and a visual blight on the city’s western edge. Boston had also exhausted most buildable land on the Shawmut Peninsula through earlier fill dating to 1820.
The legislature appointed commissioners in 1850 and 1851 to investigate tidal flat ownership. A permanent board was established in 1852. In 1854 the Commonwealth signed indentures with the Mill Corporation and Boston Water Power Company, securing rights to fill. The Commissioners on the Back Bay were renamed the Commissioners on Public Lands in 1861. Architect Arthur Gilman submitted the street plan in November 1856: Commonwealth Avenue at 200 feet wide with a 100-foot central mall, perpendicular cross streets lettered A through H in an alphabetical British naming convention. Filling began in fall 1857.
The fill source was glacial gravel at Needham, Massachusetts, 9 miles inland. Contractors Norman Munson and George Goss, railroad builders by trade, extended lines to the Needham quarries, designed purpose-built side-dump rail cars, and ran 35-car trains every 45 minutes around the clock. Steam shovels loaded at Needham; locomotives hauled to the fill zone; track was laid, used, and pulled up behind the advancing fill. When Needham deposits exhausted after roughly 24 years of operation, additional material came from Canton, Dedham, Hyde Park, and Westwood. The fill advanced east to west through the 1870s, reaching Massachusetts Avenue by 1881 and the Fens area through 1900.
The Commonwealth of Massachusetts, not the city, owned the filled land as it was created. That ownership permitted deed restrictions requiring stone or brick construction, specified setbacks, minimum heights, and restricted non-residential uses. Those restrictions ran with the land. Of the Commonwealth’s roughly 4,723,856 square feet, approximately 43 percent became public streets, 8 percent was donated to institutions, and the remaining 49 percent (roughly 2,316,796 square feet) was sold as building lots. Lot sales helped offset fill costs; 1,156 buildings rose on original Back Bay lots through 1929; all but two original lots were built upon by 1925.
Frederick Law Olmsted began advising the Boston Park Commission in 1878. His problem at the western edge of the fill was sanitary: Stony Brook drainage remained foul and the low-elevation terminus of the fill flooded periodically. Olmsted designed a 30-acre tidal basin with 20 additional acres available as overflow, integrating sanitary engineering with landscape. The Back Bay Fens, the first segment of the 1,100-acre Emerald Necklace, was a drainage system that happened to be beautiful.
All structures in Back Bay rest on wooden pilings driven 30 to 40 feet into clay beneath the fill. Those pilings remain sound while submerged in anaerobic groundwater. When water table levels drop below piling tops, from leaking sewers or tunnel drainage, the exposed wood rots. The Boston Groundwater Trust monitors water table elevations continuously. Foundation deterioration is ongoing in portions of the neighborhood and has no defined endpoint. It is a direct consequence of building on fill and requires active management indefinitely.
The rail-delivery constraint was central to Back Bay’s character. Hydraulic dredge delivery, which Galveston would demonstrate three decades later, can place millions of cubic yards per month. Rail fill is sequential, slow, and dependent on continuous track adjustment. Back Bay took 43 years to complete 580 acres. Hydraulic operations at comparable scale take years, not decades.
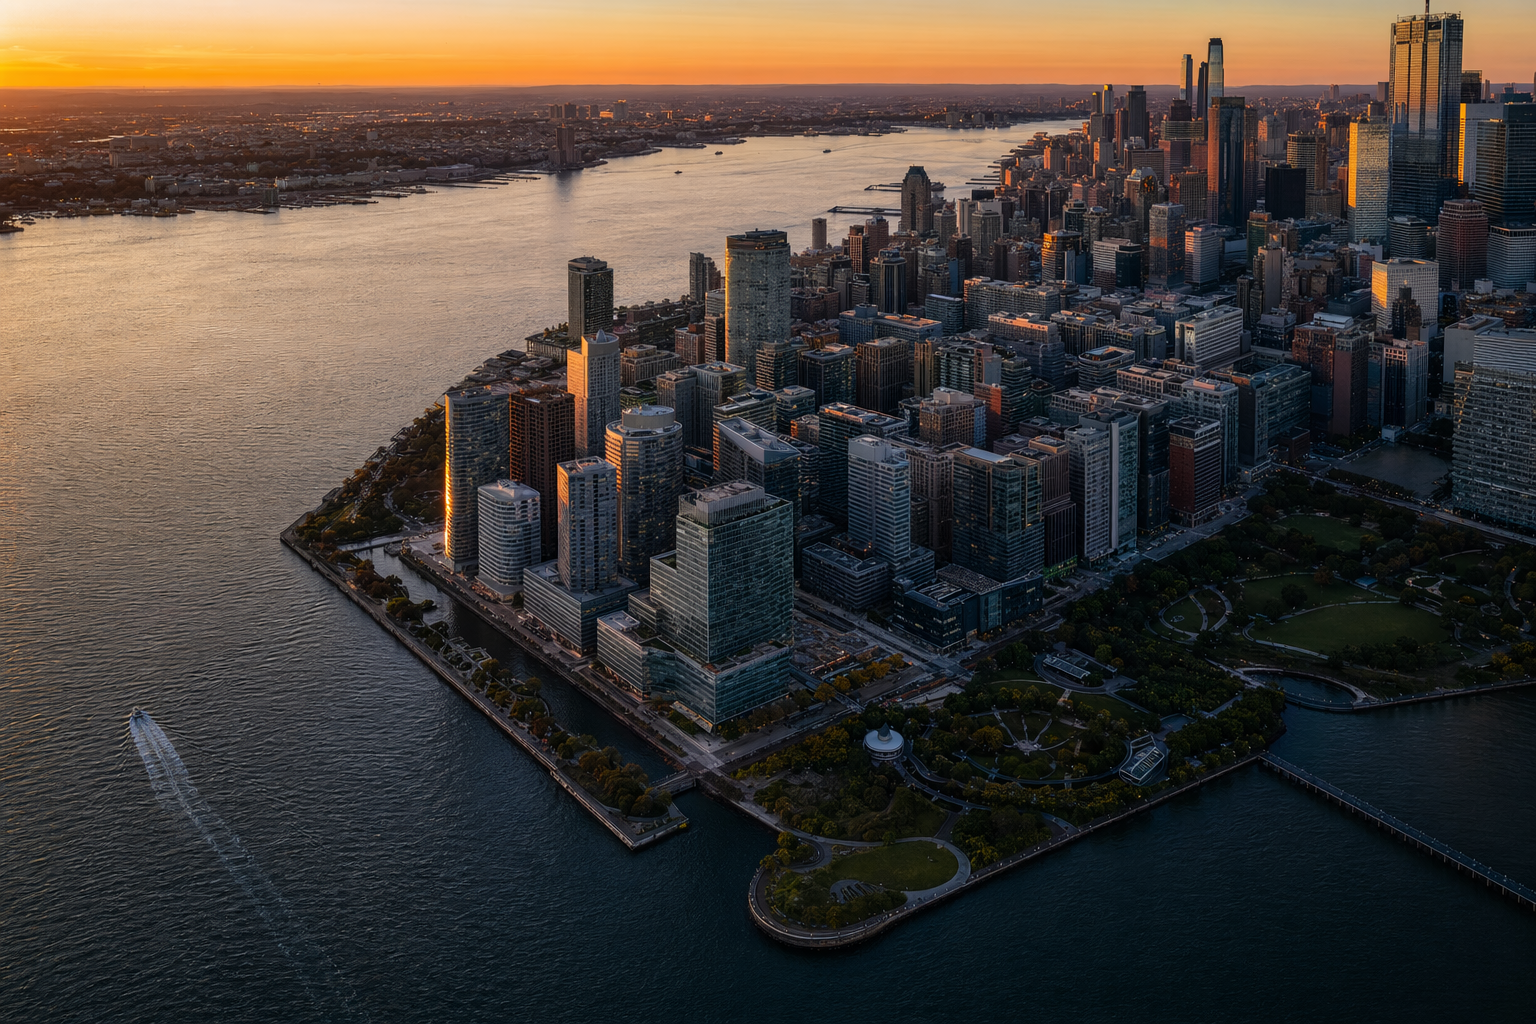
Battery Park City, Manhattan (1968-Present)
The lower Manhattan waterfront in the late 1950s was a strip of underused piers, rendered obsolete by containerization and the shift of cargo to Port Newark and Port Elizabeth. Governor Nelson Rockefeller unveiled a plan for a “comprehensive community” on new land extending into the Hudson in 1966. The New York State Legislature created the Battery Park City Authority in 1968. Rockefeller signed the enabling legislation in June. The Authority received powers to acquire and hold real property, enter leases, borrow money, and issue debt. It has never sold a parcel in fee.
Fill came from three sources: soil and rock excavated during World Trade Center construction (proceeding from 1966 onward), spoil from New York City Water Tunnel construction, and sand dredged from New York Harbor near Staten Island. Total material exceeded 3 million cubic yards. Cellular cofferdams retained fill during placement. The WTC excavation generated the bulk of southern fill; harbor dredge completed the platform. Fill was in place by 1976. The land sits 700 to 2,000 feet west of the original shoreline depending on location.
BPCA’s first decade was largely unproductive. In 1972 the Authority issued $200 million in bonds and designated Harry Helmsley as lead developer. That plan stalled. By the late 1970s the Authority was a state fiscal problem, with fill complete but no buildings on it. The revival came under Governor Hugh Carey. His administration accepted a new master plan from Alexander Cooper and Stanton Eckstut in November 1979. The plan abandoned the superblock model of the earlier scheme and connected Battery Park City to Manhattan’s existing street grid. It called for commercial, residential, and retail uses with approximately one-third designated as public parks and esplanades. That 1979 plan is the governing framework that produced the neighborhood.
Olympia and York, led by Paul and Albert Reichmann, developed the commercial core: four towers by Cesar Pelli, construction beginning in 1981 and substantially complete by 1985. Gateway Plaza, the first residential building, completed in 1983. Stuyvesant High School opened in 1992 ($150 million construction cost). Goldman Sachs headquarters at 200 West Street was built 2005 to 2009. As of 2023, Battery Park City had approximately 16,990 residents at roughly 119,000 per square mile.
The financial architecture is distinctive. BPCA holds all land permanently and leases parcels to private developers who own their buildings. Leaseholders pay ground rent to BPCA and Payments in Lieu of Taxes, which substitute for conventional real estate taxation and flow through the Authority to New York City. BPCA debt is backed primarily by PILOT income and base rents. Senior lien bonds carry AAA ratings from Fitch and Moody’s. The Authority has approximately $430 million in AAA-rated senior bonds outstanding, approximately $300 million in junior-lien bonds rated Aaa/AA+, and $148.7 million in unrated junior bonds placed privately. In 1989 a single agreement directed $600 million to New York City. By 2007, aggregate transfers exceeded $1.4 billion. Annual contributions have run approximately $200 million in recent years. In 2023, PILOT payments totaled approximately $298 million and ground rent approximately $57.3 million, producing roughly $382 million in annual revenue on 92 acres.
That revenue funds 36 acres of public parks without direct taxpayer subsidy. The Authority maintains the parks from operating revenues and transfers the remainder to city and state coffers.
The fill source was the critical cost advantage. The WTC excavation was happening regardless; BPCA captured material that would otherwise have required disposal. Harbor dredge completed the platform. Neither source required borrow-area permitting or long-distance transport. The 1979 plan recognized this advantage and built an institution capable of capturing the value that would accumulate on the land over decades.
Superstorm Sandy inundated ball fields and sections of West Street in October 2012. The elevated fill platform (most of the site sits 8 to 10 feet above mean low water) reduced building damage compared to adjacent lower-elevation areas. Sandy initiated the Lower Manhattan Coastal Resiliency project and subsequent BPCA bond sales for waterfront improvements.
Treasure Island, San Francisco Bay (1936-1937)
The concept for an artificial island in San Francisco Bay appeared in a letter to the San Francisco News in February 1933, proposing a world’s fair site to celebrate the completion of the Bay Bridge and Golden Gate Bridge. The political logic ran deeper: San Francisco needed a second airport, and a fair would generate the political support and federal funding to build what was primarily infrastructure. The island was intended to transition to aviation use after the exposition closed.
Architects W.P. Day and George Kelham evaluated candidate sites and chose Yerba Buena Shoals, a naturally shallow area northeast of Yerba Buena Island with rock close to the surface. Shallow bathymetry reduced dredging volumes substantially compared to deeper alternatives.
The Army Corps of Engineers initiated construction on February 11, 1936. The operation had two phases: perimeter containment and interior fill. For the perimeter, 287,000 short tons of quarried rock were taken from Yerba Buena Island’s own geology, forming retaining walls around the island boundary. For the interior, the pipeline dredge San Joaquin siphoned bay floor material (predominantly sand) and pumped it inside the rock walls. Average fill depth was approximately 23 feet of dredged bay sand. Total area reached 400 acres. Construction was complete by August 24, 1937, 18 months from groundbreaking. The 1936 cost was $4.7 million.
The Golden Gate International Exposition opened February 18, 1939 and ran two seasons through September 1940, drawing approximately 17 million visitors. Pan American Airways operated flying boats from purpose-built hangars, using the island as a Pacific transoceanic hub during the exposition’s run.
The anticipated airport conversion did not happen. The Navy moved in under a 1941 war lease. Naval Station Treasure Island became a major Pacific theater reception and processing center. At peak, more than 12,000 men per day were processed for Pacific assignments. The base remained operational through the Cold War, Korea, and Vietnam. Environmental remediation after the 1993 Base Realignment and Closure designation revealed contamination that included radiological materials with readings 400 times the EPA’s human exposure limits, plus petroleum products and heavy metals. The base closed in 1997.
San Francisco purchased the island from the federal government for $105 million. The Treasure Island Development Authority was created by the 1997 Treasure Island Conversion Act. Lennar Urban, Stockbridge Capital Group, and Wilson Meany entered a joint venture in 2006 to develop the site. The San Francisco Board of Supervisors approved a $1.5 billion redevelopment plan in 2011 calling for up to 8,000 residences, five high-rise towers, 450,000 square feet of commercial space, and 275 to 300 acres of parks. The first high-rise, Isle House at 22 floors and 250 units, opened September 2024. Total build-out is projected to take 20 to 30 years.
The fill composition creates three interacting liabilities that were not priced in 1936. First, liquefaction: 23 feet of loose saturated bay sand loses shear strength under seismic loading; estimated remediation cost is $137 million. Second, subsidence: the island surface has been sinking since 1937 as underlying bay mud consolidates; the rate has decelerated by approximately 40 percent since 2004 but has not stopped. Third, sea level rise: the island was built at or near sea level, and TIDA’s planning models a range of up to 66 inches (167 cm) of SLR, with a 16-inch (40 cm) first-phase threshold and a 30-inch adaptive management trigger. The perimeter elevation work already underway is a second fill operation being conducted on top of the first.
The 22-month construction timeline demonstrated what hydraulic dredging enables. Back Bay required 43 years for 580 acres. Treasure Island completed 400 acres in under two years using contemporaneous 1930s equipment. The speed advantage of hydraulic delivery is not marginal.
Galveston Grade-Raising (1902-1911)
The September 8, 1900 hurricane struck Galveston with sustained winds estimated at 140 to 145 mph. Storm surge reached approximately 16 feet, overtopping the island’s highest natural elevation of roughly 8.7 feet. Galveston had a population of approximately 37,000 to 38,000. Death estimates range from 6,000 (historical consensus minimum) to more than 8,000. The storm destroyed approximately 3,636 homes and 7,000 buildings total. Property damage was $30 million in 1900 dollars.
Before the storm, Galveston was Texas’s dominant port and one of the largest cotton-exporting ports in the world. Reconstruction was as much an economic necessity as a humanitarian one.
The city convened a three-member engineering board in January 1902. Henry Martyn Robert (Army Corps of Engineers, chairman), Alfred Noble (president of the American Society of Civil Engineers in 1903), and Henry Clay Ripley presented their report on January 25, 1902 with two interconnected recommendations: build a concrete seawall along the Gulf front, and raise the grade of the city using hydraulic fill.
Seawall construction ran from 1902 to 1904 for the initial section: 17,593 linear feet of curved-face concrete gravity structure, base width 16 feet, top width 5 feet, top elevation 17 feet above mean low water, weight approximately 40,000 pounds per linear foot. The curved face deflects wave energy upward rather than allowing vertical overtopping. By 1963, when the final extension completed, the seawall stretched more than 10 miles. Total cost across all sections was $14.5 million in contemporary dollars, approximately $131 million in 2001 terms.
The grade raising was more complex. Engineers built a temporary canal approximately 20 feet deep, 200 feet wide, and 2.5 miles long through the interior of the city. Four hopper dredges drew sand from the harbor entrance and ship channel approaches, motored up the canal, and discharged through a pipe network into each working section. The method was section-by-section: perimeter dike first, then all structures raised on jacks or temporary pilings, then sand slurry pumped in, then structures lowered to new grade and utilities reconnected. Approximately 2,000 to 2,100 buildings were raised, including the 3,000-ton St. Patrick’s Church. Total fill placed was 16.3 million cubic yards across 500 blocks. Elevation gain ranged from minimal at the Gulf front (where the seawall already protected) to 17 feet on the bay side, creating a continuous slope. The combined seawall and grade-raising program cost approximately $6 million in contemporary dollars, equivalent to roughly $140 million today.
The 1915 hurricane struck while grade raising was still in progress. Galveston recorded 11 deaths compared to 6,000 to 8,000 in 1900.
The engineering succeeded; the economics did not. The Houston Ship Channel opened in 1914, providing a sheltered inland harbor and diverting commercial shipping to Houston. Galveston transitioned from commercial port to residential and tourism economy. Barrier island geography, which made the city vulnerable, also limited its ability to compete with a protected inland port. The engineering triumph did not override the structural disadvantage.
The enabling factor was the fill source: proximate harbor sand, hydraulically deliverable. The canal-and-pipe distribution system eliminated overland transport. A fill operation that would have required decades by rail was executed in years by dredge. This is the same advantage Treasure Island demonstrated and the same that Battery Park City replicated.
Chicago Lakefront (1830s-1920s)
Chicago’s lakefront reclamation began with an 1836 ordinance designating land along Lake Michigan as “public ground forever open, clear and free.” That language derived from the public trust doctrine and was embedded in the original federal land grant. It has since been affirmed by four Illinois Supreme Court rulings and remains operative.
The doctrine was tested by the Illinois Central Railroad in the 1890s. The Supreme Court ruled in Illinois Central Railroad v. Illinois in 1892 that the Illinois legislature could not grant the railroad the entirety of the Chicago harbor: submerged lands under navigable water belong to the public in trust and cannot be alienated to private parties in fee. That ruling established that lakefill in Chicago would produce public land, not private real estate. Retailer Aaron Montgomery Ward reinforced the doctrine through litigation from approximately 1890 to 1909, winning repeated court victories that prevented construction of buildings on the lakefront park strip adjacent to his Michigan Avenue store.
Daniel Burnham and Edward Bennett published the Plan of Chicago in 1909. The lakefront section called for continuous linear parkland from the north city limit to the state border, built on lakefill, with offshore islands connected by lagoons, expanded harbor facilities, and recreational infrastructure. “The lakefront by right belongs to the people,” Burnham wrote. The plan was not fully executed, but its governing principle shaped four decades of fill work.
The major fill projects:
Grant Park encompasses 319 acres, most of it on landfill and above underground parking. Congress approved extending the park 300 feet eastward in 1914; the Field Museum opened on freshly completed fill in 1920.
Northerly Island, the one piece of Burnham’s island chain actually built, is 91 acres. Chicago voters approved a $20 million bond in 1920; the island was complete by 1925. It hosted the 1933 to 1934 Century of Progress World’s Fair and served as Meigs Field general aviation airport from 1948 until Mayor Richard Daley had the runway demolished overnight without public notice in March 2003.
Navy Pier extends 3,300 feet into Lake Michigan from a piling foundation, covering approximately 50 acres of lake surface. It opened July 15, 1916.
Burnham Park, extending 6 miles from Grant Park south to Jackson Park, is the largest single fill project on the Chicago lakefront at 598 acres. Construction began in 1920. Engineers drove parallel rows of timber pilings into the lakebed, connected them with steel rods, filled the resulting cribs with quarry rock, then filled between cribs and the original shoreline with lakebed dredge material, construction debris, and sand from Indiana and Michigan. The first use of steel sheet pile in Lake Michigan appeared at Montrose Harbor during the 1930s.
The Museum Campus, 57 acres, holds the Field Museum, Shedd Aquarium, and Adler Planetarium. The Adler and Shedd both opened in 1930 on fill.
Not all lakefill was public. The North Chicago Rolling Mills (U.S. Steel predecessor) began dumping slag into the lakefront near the Calumet River mouth in the late 1870s. By 1922, industrial fill extended the company’s property to 573 acres, the largest single fill operation in Chicago history. The public trust doctrine prevented private lakefill on the downtown park strip but did not apply to the industrial zone south of the city center.
Total lakefill within Chicago city limits exceeds 5.5 square miles. The public park fill (Grant Park, Burnham Park, Northerly Island, Museum Campus) accounts for roughly 1,000 acres of that total. The fill created no fiscal return directly. Battery Park City’s ground-lease model captures ongoing revenue; Chicago’s doctrine produced public amenity. Michigan Avenue, facing Grant Park, carries among the highest land values in the Midwest. The fill created conditions for adjacent private value accumulation without capturing any of it.
The institutional ownership decision at creation determined everything. Chicago’s public trust commitment, made in 1836 and enforced repeatedly by litigation, produced a public amenity without a revenue model. BPCA’s 1968 charter, by contrast, was designed from the start to capture ground-lease value from the land it created. Both were valid choices. The outcomes are structurally different.
Louisiana CPRA (2007-Ongoing)
Louisiana lost approximately 1,900 square miles of coastal territory between 1932 and 2016, confirmed by USGS mapping. The Barataria Basin alone lost over 400 square miles in that period. Without intervention, CPRA projects an additional 1,100 to 3,000 square miles lost over the next 50 years. The state loses an area the size of a football field every 100 minutes.
The causes are structural. Flood control levees on the Mississippi, built by USACE through the 20th century, cut the river off from its delta plain. Pre-levee, the Mississippi regularly overtopped its natural banks, depositing sediment that built and maintained coastal wetlands. Leveed, that sediment passes directly to the continental shelf. Organic sediments compact without replenishment. Combined with sea level rise, effective relative sea level rise in coastal Louisiana exceeds 1 inch per year in some locations. Oil and gas canal dredging cut thousands of miles through coastal marshes, destroying integrity and accelerating saltwater intrusion.
CPRA was created by Act 8 of the First Extraordinary Session of the Louisiana legislature in 2005, mandated by Hurricanes Katrina and Rita. Congress required it in Public Law 109-148. The first Coastal Master Plan appeared in 2007. Four iterations followed: 2012 introduced modeling-based project prioritization; 2017 incorporated updated sea level rise projections; 2023, passed unanimously by the state legislature, established the 50-year, roughly $50 billion framework.
Funding has been event-driven. The Coastal Wetlands Planning, Protection and Restoration Act (CWPPRA, 1990) has provided $40 to $85 million annually in federal funding. From 1991 to January 2017, CWPPRA authorized 214 projects, protecting and restoring more than 97,000 net acres at a total cost of $1.8 billion. The BP Deepwater Horizon settlement, through the RESTORE Act of 2012 and the Natural Resource Damage Assessment process, directed an estimated $7 to $8 billion primarily to Louisiana coastal restoration through approximately 2031. Louisiana has received more than $930 million through RESTORE Act channels.
The cornerstone project of the 2023 plan was the Mid-Barataria Sediment Diversion: a $2.9 billion structure connecting the Mississippi to the Barataria Basin through a controlled diversion capable of 75,000 cubic feet per second during peak sediment periods. CPRA projected it could build and sustain up to 26,000 acres of wetlands over 50 years. The U.S. Army Corps of Engineers issued a Record of Decision in December 2022. The Louisiana Trustee Implementation Group approved $2.26 billion in construction funding February 1, 2023. Groundbreaking was August 10, 2023. Construction halted approximately November 2023 following a Plaquemines Parish lawsuit. Governor Jeff Landry cancelled the project in early 2025. Approximately $700 million had been spent; more than $1 billion in contracts were signed.
The stated cancellation rationale included costs, permitting concerns, and litigation. The underlying driver was seafood industry opposition. The Barataria Basin supports significant oyster and shrimp production. Oystermen, unlike shrimpers, cannot relocate product as salinity shifts; freshwater influx from the diversion would have altered salinity regimes their beds depended on.
CPRA’s cumulative reported results through 2023: 193 million cubic yards of sediment placed, 55,807 acres benefited, 71.6 miles of barrier islands restored, 369 miles of levees improved. The program is slowing coastal land loss; it is not reversing it.
The MBSD cancellation is the most significant institutional event in US coastal engineering in decades. The largest single coastal restoration project in US history was terminated after $700 million spent, not for technical failure but for political opposition from a single industry. The lesson is consistent with the scale-creates-stakeholders pattern that appears in every large reclamation program: more acres means more parties with interests in how the land and water respond.
Miami Beach Renourishment (1976-Ongoing)
Miami Beach nourishment is the oldest continuous municipal beach management program in the United States. The formal program dates to 1976, though beach management in various forms began earlier. Since 1981, cumulative expenditure exceeds $200 million. The program places sand every 2 to 4 years on roughly 10 miles of Atlantic-facing beach.
Unit costs at Miami Beach run $30 to $50 per cubic yard. At 50,000 cubic yards per mile of berm, each nourishment cycle costs roughly $1.5 million to $2.5 million per mile before mobilization. The escalation trend is upward: traditional proximate borrow areas in state waters are exhausted. The narrow SE Florida continental shelf (5 to 20 km wide, 20 to 40 meters deep at 5 miles offshore) limits survey area, and the Florida Reef Tract in Miami-Dade and Broward constrains dredge corridors. Sand searches now extend further offshore and require multibeam sonar and sub-bottom profiling to locate non-obvious sand bodies. BOEM-funded research has identified hundreds of millions of cubic yards of sediment on the broader Outer Continental Shelf, but at greater distance from shore, driving up pipe run lengths and unit costs.
State investment in beach management since 1998 exceeds $1.55 billion from trust funds and general revenue. Florida EDR analysis found that a $44 million state investment in one review period produced an average annual GDP increase of $2.4 billion and increased state revenue by $237.9 million over three years. The economic case for nourishment is strong by those numbers. The structural case is weaker: nourishment is maintenance, not production. The sand placed this year is not the sand that will be there in three years.
BOEM has signed 22 Florida leases out of 58 national leases since the Marine Minerals Program began in 1995, authorizing more than 164 million cubic yards of sediment nationally. Northeast Florida (St. Johns and Flagler counties) has better OCS sand access at lower cost, estimated $10 to $25 per cubic yard, compared to Miami Beach’s $30 to $50. The structural sand shortage is a SE Florida problem, not a statewide one.
The florida-case-study covers SE Florida sand depletion in the context of regional reclamation planning.
Patterns Across the Cases
Three themes recur regardless of era, method, or geography.
Hydraulic delivery determines speed. Back Bay required 43 years for 580 acres using purpose-built rail at 35-car-per-45-minute frequency around the clock. Treasure Island completed 400 acres in 22 months using a single pipeline dredge. Galveston raised 500 city blocks in roughly 9 years of active work using four hopper dredges and a distribution canal. Battery Park City placed 3 million cubic yards in years, not decades, by capturing WTC excavation material. The speed difference between rail fill and hydraulic fill is not incremental. It is an order of magnitude. This is why every large-scale reclamation program since 1900 has used hydraulic methods where geology permits.
Institutional ownership at creation determines who captures value. The Commonwealth of Massachusetts owned Back Bay as it was created and captured deed restriction authority that shaped the neighborhood’s built form for 150 years; it sold the land in fee and the value accrued to private purchasers thereafter. BPCA was chartered in 1968 with permanent public ownership and a ground-lease structure that has since generated $382 million annually in PILOT and ground rent, transferred more than $1.4 billion to New York City, and maintains AAA bond ratings. Chicago’s public trust doctrine, affirmed repeatedly by the courts, converted every acre of lakefill into public amenity with no revenue return to the fill investor. All three institutional choices were coherent given their goals. The outcomes are structurally different. For reclamation at scale to fund itself, the BPCA model is the relevant precedent; Chicago’s model produces public goods without fiscal closure.
Long-term liabilities are consistently unpriced at inception. Back Bay’s wood piling foundations require perpetual groundwater management with no defined endpoint. Treasure Island is subsiding on loose saturated sand with $137 million in estimated liquefaction remediation plus an open-ended sea level rise adaptation program. Galveston’s grade raising saved the city from storms but could not prevent Houston’s competitive displacement once the Ship Channel opened in 1914. Louisiana CPRA has placed 193 million cubic yards of sediment over 20 years and is still losing ground at a rate faster than it can rebuild. Miami Beach’s sand deficit grows with each nourishment cycle as proximate sources deplete. The pattern is not specific to any method or era. The initial project scope captures the capital cost; the operational and remediation costs appear later and are borne by successors who did not make the original decision.
These patterns are not arguments against reclamation. They are conditions that any serious project planning must account for rather than discover after the fact. The economics-and-value-capture document covers the financial architecture in detail. The institutions-and-permitting document covers the regulatory stack any new US project inherits.