New reclaimed land is not safe by default. It sits at whatever elevation the engineer chose, and that elevation must be high enough to survive storm surge, wave run-up, and sea-level rise over the project’s lifetime, with some margin for subsidence. Getting the elevation wrong means the investment drowns. Getting it too conservatively wrong means the land costs more to build and less to develop. This document covers the physics, the models, the barriers, the scenarios, and the design arithmetic that govern the decision.
Design-storm framework
Every piece of coastal infrastructure is sized against a design storm defined by its annual exceedance probability or return period. These are equivalent expressions of the same thing: a 100-year event has a 1% annual probability of being equaled or exceeded in any given year, which translates to a 26% probability of occurring at least once in a 25-year period.
| Return period | Annual exceedance probability | Common application |
|---|---|---|
| 50-year | 2% | Secondary coastal infrastructure |
| 100-year | 1% | FEMA base flood elevation; standard floodway |
| 200-year | 0.5% | USACE standard for urban levees |
| 500-year | 0.2% | Critical infrastructure, nuclear facilities |
| 1,000-year | 0.1% | Eastern Scheldt design basis |
| 4,000-year | 0.025% | Eastern Scheldt protection standard |
| 10,000-year | 0.01% | Maeslantkering protection standard, Rotterdam |
FEMA’s National Flood Insurance Program uses the 100-year event as its regulatory standard. The Special Flood Hazard Area designation covers land that would be inundated by this event; structures in SFHAs must be elevated to the Base Flood Elevation plus any required freeboard. The FEMA methodology is documented in the Coastal Construction Manual (FEMA P-55) and the flood hazard guidelines at 44 CFR Part 65.
The Probable Maximum Hurricane is a separate concept used for nuclear plant siting and major dam design. It is not a return-period event but a physical upper bound derived from maximum storm intensity analysis given regional thermodynamic constraints. For general coastal infrastructure, PMH analysis bounds the worst physically possible scenario but is not itself a design target.
Choice of design return period reflects consequence analysis. Rotterdam chose 10,000 years because flooding the Rhine-Maas delta with a modern port and two million people behind it produces a loss exceeding anything that can be accepted. Galveston chose a lower standard, and the 1900 hurricane killed six to eight thousand people. The standard is a policy decision, not a physics constraint, and it is the single most consequential choice in freeboard design.
Surge hydrodynamics
Storm surge is the anomalous rise of sea surface above predicted astronomical tide caused by two forces acting simultaneously: atmospheric pressure deficit and wind stress.
The pressure contribution is direct: for every millibar of pressure deficit below ambient, sea surface rises approximately one centimeter. A major hurricane at 900 mb central pressure against a 1013 mb ambient field produces roughly 1.13 m of pressure-driven surge before wind effects are counted.
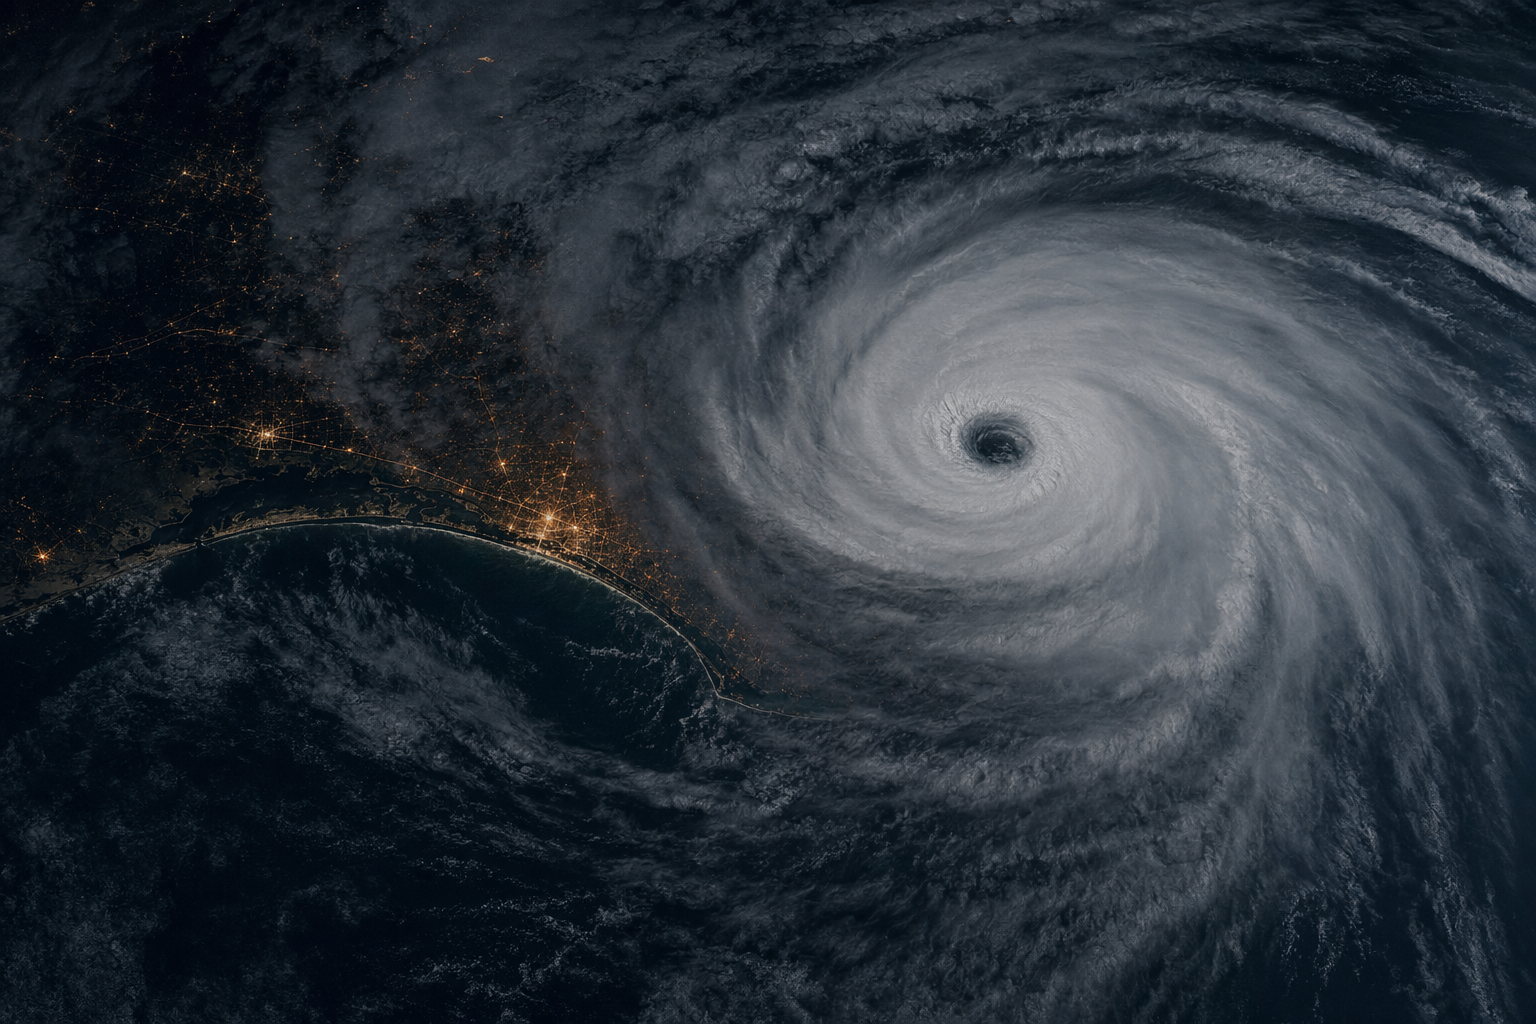
Wind-driven surge dominates on the open coast and depends critically on shelf geometry. The scaling relation is roughly: surge height is proportional to wind stress times fetch over shallow water, divided by water depth. Wide, shallow shelves amplify this term enormously. The West Florida shelf runs 120 to 180 km wide at depths of 6 to 15 m, one of the most efficient surge amplifiers on the Atlantic basin. Hurricane Ian in 2022 produced 10 to 15 feet of surge on the Fort Myers Beach corridor; at the same intensity on a steeper Atlantic shelf, the surge would have been substantially lower.
The Gulf of Mexico states share this exposure. Houston-Galveston sits behind Galveston Bay, which acts as a resonant basin for Ike-type storms with resonance periods matching surge duration, producing interior bay surges exceeding the open-coast value. NOAA’s post-storm analysis put Ike surge at 7 m on the Bolivar Peninsula in 2008.
SLOSH
SLOSH (Sea, Lake, and Overland Surges from Hurricanes) is NOAA’s operational forecast model, used by the National Hurricane Center during landfalling events. It uses a finite-difference grid on polar coordinate meshes nested around coastal basins, resolves large-scale surge in minutes, and allows ensemble runs across storm track and intensity uncertainty. That speed is what makes it operationally useful.
SLOSH has known limits. It cannot capture small-scale coastal features such as inlet geometry, levee breaches, or narrow channels. In complex estuarine environments it systematically underpredicts peak surge. It is not a design tool.
ADCIRC
ADCIRC (Advanced Circulation Model) uses an unstructured finite-element mesh that resolves coastline geometry and bathymetric gradients at fine resolution, down to meters in nearshore areas and kilometers offshore. Coupled with the SWAN wave model, ADCIRC captures wave-current interaction and the contribution of wave setup to total water level.
ADCIRC is the engineering design standard for coastal flood modeling. It was used to validate the post-Katrina Greater New Orleans levee system, to characterize Ike surge on the Texas coast, and to develop FEMA Flood Insurance Rate Maps along the Gulf. A single storm simulation on ADCIRC requires hours to days on high-performance computing clusters. Ensemble runs are more expensive still. This cost is justified for major infrastructure design but not for operational forecasting.
For a new reclaimed district, the design process works in sequence: run ADCIRC ensembles covering the joint distribution of storm tracks, intensities, tidal phasing, and SLR scenarios; extract the surge envelope at the design return period; add wave effects and run-up; set freeboard; validate against historical post-storm surveys.
Wave run-up and setup
Still-water surge is not the full water level problem. Waves breaking in the surf zone and running up slopes add substantially to the effective water level that new land must stand above.
Wave setup
Breaking waves transfer momentum to the water column. The momentum flux gradient drives a mean water level rise at the shoreline called wave setup. A simplified relation for setup at the shoreline:
eta_setup is approximately 0.19 times (1 minus 2.82 times the square root of H_b divided by L_0) times H_b
where H_b is breaking wave height and L_0 is deepwater wavelength. Wave setup contributes 10 to 20 percent of H_b in typical conditions. On open coasts exposed to large swell, setup adds 0.3 to 1.0 m above the still-water storm tide. This component is missing from storm-surge-only design and leads to systematic underestimates of total water level on exposed coasts.
Stockdon parameterization
Wave run-up (R) is the maximum elevation above still water reached by wave swash on a beach slope. Stockdon et al. (2006) derived an empirical formula for the 2% exceedance run-up on dissipative to intermediate beaches:
R_2% = 1.1 times the sum of (wave setup) plus the square root of the quantity H_0 times L_0 times the quantity (0.563 times the Iribarren number squared plus 0.004), divided by 2
where H_0 is deepwater wave height, L_0 is deepwater wavelength, and the Iribarren number equals beach slope divided by the square root of wave steepness. Run-up scales with offshore wave height and wave period. Steep beaches produce higher run-up than flat beaches for the same offshore conditions.
The Stockdon formula has been validated against extensive field measurements across a range of beach types and storm intensities and is the standard reference for run-up design in the US coastal engineering practice. FEMA provides run-up tables based on it in the Coastal Construction Manual. For armored slopes and seawalls, separate empirical formulas specific to the slope geometry and armor type apply; rock-armored slopes reduce run-up relative to sandy beach slopes.
Freeboard design
The full design elevation for new fill combines every contributing water level component:
Design elevation = MHHW + design storm surge + wave setup + 2% run-up + freeboard allowance + SLR over design life + expected consolidation settlement
The storm-and-slr-design source documents an example for a 50-year design life residential development on Gulf Coast fill using NOAA Intermediate SLR (Sweet et al. 2022):
| Component | Amount |
|---|---|
| Mean higher high water (MHHW) | +0.5 m NAVD88 |
| 100-year surge | +3.5 m |
| Wave setup | +0.3 m |
| 2% run-up | +0.5 m |
| Freeboard allowance | +0.5 m |
| SLR, NOAA Intermediate, 50 years | +0.4 m |
| Initial fill settlement | +0.5 m |
| Minimum finished grade | +5.7 m NAVD88 |
Extending the design life to 100 years with NOAA Intermediate-High SLR (1.5 m by 2100) replaces the 0.4 m SLR term with 1.5 m, pushing minimum grade to approximately 6.8 m NAVD88.
The 0.5 m freeboard allowance in this example is a policy margin above the calculated design water level. It accounts for model uncertainty, forecast error, and the practical impossibility of exactly achieving every input assumption. USACE guidance allows this freeboard to vary with the consequence class of the structure; critical infrastructure uses wider margins.
The range of finished grades seen in major built projects brackets this arithmetic. Maasvlakte 2 standard elevation is +5 m above MSL. Lynetteholm’s perimeter crests at +2.5 m now, rising to +5.5 m at final build under projected 22nd-century Baltic sea levels. Kansai Island 1 was built to +4 m and has since settled 13.66 m, reaching its current effective elevation only because the seawall adjusts continuously.
Major surge barriers
Five built or authorized structures define the current state of the art for bay-scale surge defense. Their key parameters are summarized below.
| Structure | Location | Protection standard | Key parameters | Status |
|---|---|---|---|---|
| Maeslantkering | Rotterdam, Netherlands | 10,000-year return period | Two 210 m truss arms; 360 m channel width; closure at 3 m above NAP | Operational 1997 |
| Eastern Scheldt (Oosterscheldekering) | Netherlands Delta Works | 4,000-year return period | 9 km, 65 concrete piers, 62 sliding steel gates; EUR 2.5 B | Operational 1986 |
| MOSE | Venice, Italy | Gates raise at 110 cm above MSL | 78 hinged flap gates at 3 lagoon inlets; EUR 5.49 B actual cost | Operational 2021 |
| Thames Barrier | London, UK | 1,000-year return period | 10 gates, 520 m width; design life to 2070 | Operational 1982 |
| Galveston Bay Barrier (Ike Dike) | Houston-Galveston, TX | Major hurricane surge | 94 km coastal spine; $57 B 2023 estimate | Authorized 2022; construction funds not yet appropriated |
Maeslantkering
The Maeslantkering protects Rotterdam and the Rhine-Maas delta against North Sea surge. Constructed 1991 to 1997, it consists of two hollow steel truss arms, each 210 m long, hinged on concrete pivot points on opposite banks of the Nieuwe Waterweg. The arms rotate to close and flood with water ballast. The total protected channel width is 360 m.
The design protection standard of 10,000 years (Sweet et al. 2022, Watersnoodmuseum) means the structure is designed for conditions with a 0.01% annual probability of being exceeded. It is also designed to withstand 5 m of sea-level rise, meaning it does not become obsolete under even the most aggressive SLR scenarios currently in the literature.
Closure is automated. The BOS computer system monitors surge forecasts continuously and triggers closure without requiring human approval when the forecast exceeds 3 m above NAP. This design choice reflects the operational reality that extreme surge events arrive on timescales that may not accommodate deliberative human decision-making. The barrier has closed multiple times in the last decade as surge frequency has increased.
Eastern Scheldt
The Eastern Scheldt barrier is the largest structure in the Dutch Delta Works. Completed in June 1986 after ten years of construction, it spans 9 km across three tidal channels with 65 concrete piers and 62 sliding steel gates. Normal operations leave the gates open to preserve tidal dynamics in the estuary; the gates close when surge forecasts exceed 3 m above NAP.
The decision to build a semi-permeable barrier rather than a closed dam followed intense political controversy in the Netherlands about the destruction of the Zeeland estuarine ecosystem. The compromise costs something: reduced tidal prism from the partially closed estuary has caused progressive erosion of tidal flats within the barrier, a phenomenon called “sand hunger” that continues to require attention. For reclamation planning, the Eastern Scheldt is the canonical demonstration that tidal prism management and gate operations interact in ways that require long-term sediment management as part of any large barrier system.
MOSE
MOSE (Modulo Sperimentale Elettromeccanico) consists of 78 hinged steel flap gates installed in four sets across the three inlets to the Venice Lagoon. The gates lie flat in seabed caissons when not in use; compressed air inflates them when surge is forecast above 110 cm above mean sea level. Gate dimensions run from 20 by 5 m at Chioggia to 28 by 5 m at Lido, and each gate weighs 300 tonnes.
The construction history is cautionary. Original cost estimates in 2003 were EUR 1.6 billion. Final cost was EUR 5.49 billion, and the project took 18 years to complete, plagued by corruption and delays. MOSE began partial operation in October 2020 and reached full operation in 2021. It buys decades for Venice, but it does not address subsidence or long-term SLR; reassessment and probable upgrades will be required before mid-century.
Thames Barrier
The Thames Barrier consists of 10 rotating-drum sector gates spanning 520 m across the Thames at Woolwich. Completed in 1982 and first closed in 1983, its design life extends to 2070 at current protection standards. Each main gate is 61 m wide and weighs 3,700 tonnes. All gates close in approximately 30 minutes.
The closure record illustrates what SLR and increased storminess do to an existing barrier over time. The barrier closed 4 times in the 1980s and more than 200 times total through the 2020s. The TE2100 Plan documents the adaptive management pathway to 2100 and acknowledges the barrier will eventually need replacement or supplementation.
Galveston Bay Barrier (Ike Dike)
Hurricane Ike struck the Texas coast in 2008, producing roughly 7 m of surge on the Bolivar Peninsula and 4 to 5 m in Galveston, causing approximately $30 billion in damages. The authorized federal response is the Coastal Texas Protection and Restoration Project, centered on a 94 km coastal spine sometimes called the Ike Dike.
The spine includes a major gate structure at Bolivar Roads, the 2-mile inlet connecting the Gulf to Galveston Bay, with floating gates more than 80 feet tall. A separate closure structure is planned at San Luis Pass. The system is designed to reduce damaged structures by 77% and flooded critical infrastructure by 64% under a major hurricane scenario.
The USACE estimated the project at $23 to $31 billion in 2018. By 2023, inflation-adjusted estimates reached $57 billion. WRDA 2022 authorized the project and funded $31 billion, split 65% federal and 35% Gulf Coast Protection District. As of early 2026, engineering contracts have been awarded for gate design, but construction funds have not been appropriated. The gate system alone is estimated at 18 years from funding to completion.
The Ike Dike illustrates the gap between authorization and execution that characterizes large US coastal infrastructure. Authorization is the beginning of the process, not the end.
Sea-level rise scenarios
All surge barrier and freeboard design must incorporate sea-level rise projections over the project’s design life. Two authoritative sources govern US practice: IPCC AR6 and the NOAA 2022 Technical Report.
IPCC AR6 global projections
| Scenario | 2050 likely range (m) | 2100 likely range (m) |
|---|---|---|
| SSP1-1.9 (very low emissions) | 0.15 to 0.23 | 0.28 to 0.55 |
| SSP2-4.5 (intermediate) | 0.17 to 0.26 | 0.44 to 0.76 |
| SSP5-8.5 (very high emissions) | 0.20 to 0.29 | 0.63 to 1.01 |
All values are relative to a 1995 to 2014 baseline. The SSP5-8.5 likely range of 0.63 to 1.01 m by 2100 does not include low-likelihood, high-impact outcomes from Antarctic marine ice sheet instability, which could add 0.5 to 2.5 m above the likely range. These tail scenarios cannot be excluded and are relevant for critical infrastructure with design lives extending to 2100 and beyond.
Long-horizon projections extend further. Under SSP1-2.6, global mean sea level rises 0.3 to 3.1 m by 2300. Under SSP5-8.5, the range is 1.7 to 6.8 m.
NOAA 2022 five-scenario framework
Sweet et al. (2022) provides the US coastal planning standard. Unlike IPCC, NOAA specifies target amounts of SLR rather than emissions pathways, making the scenarios directly usable for infrastructure design at specific sites.
| NOAA scenario | 2100 target | Relevant IPCC range |
|---|---|---|
| Low | 0.3 m (1 ft) | SSP1-1.9 low end |
| Intermediate-Low | 0.5 m (1.6 ft) | SSP2-4.5 low |
| Intermediate | 1.0 m (3.3 ft) | SSP2-4.5 median |
| Intermediate-High | 1.5 m (4.9 ft) | SSP5-8.5 median |
| High | 2.0 m (6.6 ft) | SSP5-8.5 plus partial ice instability |
USACE uses the Intermediate-High scenario (1.5 m by 2100) for most coastal project analysis. The High scenario (2.0 m) applies to critical infrastructure with design lives of 50 years or more.
SE Florida Regional Climate Compact
The SE Florida Regional Climate Compact, formed in 2009 by Monroe, Miami-Dade, Broward, and Palm Beach counties, produced a unified projection for the region: 10 to 17 inches above the 2000 baseline by 2040. This unified local projection resolved a coordination problem where individual counties had been using different baselines and scenarios, making cross-jurisdictional infrastructure planning incoherent. For any project spanning multiple counties, compact projections provide the working standard.
Subsidence coupling
Sea-level rise projections assume a stable land surface. In many coastal settings, especially those built on unconsolidated sediment, land is sinking at rates that add directly to relative sea level rise.
Relative sea level rise (RSLR) = eustatic SLR + local subsidence rate. On rapidly subsiding coasts, subsidence can exceed eustatic SLR in magnitude.
| Location | Primary cause | Total subsidence | Rate |
|---|---|---|---|
| Houston-Galveston, TX | Groundwater and oil/gas extraction | More than 2 m since 1900; Baytown area up to 3 m | Peak 12 cm/yr in 1920s to 1970s; slowed to approximately 1 cm/yr since 1978 regulations |
| New Orleans, LA | Delta compaction, groundwater withdrawal | 1 to 3 m over 20th century | 5 to 25 mm/yr, varies strongly by district |
| Kansai Airport, Japan | Pleistocene clay consolidation | 13.66 m since 1987 (Island I); 17.47 m (Island II) | Island I: 6 cm/yr current; Island II: 21 cm/yr current |
| Jakarta, Indonesia | Groundwater extraction | Up to 4 m in north Jakarta since 1970 | Up to 25 cm/yr in worst areas |
On new hydraulic fill, an additional factor applies. Fresh fill over soft substrate undergoes primary consolidation settlement of 0.5 to 2.0 m during the first 5 to 20 years. This settlement must be added to the RSLR calculation for the early life of the project, which is often the period when initial construction of buildings and infrastructure occurs.
Kansai as the binding design lesson
Kansai International Airport is the global reference case for the consequences of underestimating soft-clay consolidation under offshore fill. Island I was built to +4 m above mean sea level starting in 1987. The original settlement prediction was 5.7 to 5.8 m total. By the airport’s opening in 1994, the island had already settled 9.82 m. Cumulative settlement as of 2024 is 13.66 m on Island I and 17.47 m on Island II (Mesri and Funk 2015; Kansai Airports settlement records).
Island II settled more than Island I despite being constructed second with better geotechnical knowledge, because the seabed beneath Island II contained softer and thicker clay layers. Both islands continue to settle. Island I at 6 cm/yr; Island II at 21 cm/yr. KIX Island I is projected to reach sea level in June 2067 unless additional protective works are undertaken.
The mechanism is an anomaly in the Pleistocene clay underlying Osaka Bay. Standard Terzaghi consolidation theory predicts that consolidation slows as the soil approaches its preconsolidation pressure. The Osaka Bay Pleistocene clay does not behave this way; compression continues without decelerating secondary consolidation coefficients even under loads below the preconsolidation pressure. This was a material property inadequately modeled before construction, not a construction error.
Four design implications follow from KIX’s experience.
First, site investigation must reach the full depth of compressible strata. KIX’s Pleistocene clay extends 400 m below the seafloor. Initial borehole programs did not capture the full depth of the contributing layers.
Second, laboratory consolidation tests underestimate field settlement under large-scale fill. Sample disturbance and scale effects produce systematically optimistic predictions. Allow factor-of-two uncertainty or more.
Third, adjustable foundations should be designed in from the outset for any structure on more than 5 m of compressible substrate. KIX Terminal 1 rests on 900 individually adjustable hydraulic jack columns, inserted at retrofitting cost, that allow the building to be re-leveled as differential settlement continues.
Fourth, asphalt runway surfaces handle differential settlement better than concrete. Where settlement between any two surface points exceeds approximately 30 mm, concrete slabs crack and require replacement; asphalt can accommodate more distortion before requiring resurfacing.
The Kansai lesson does not prohibit offshore reclamation. It specifies the investigation standard and design approach for doing it on deep, compressible substrate. Sites with competent or shallow seabed geology, like Chubu Centrair on the stable Ise Bay seabed, settle far less and avoid the problem category entirely.
The parallel for the Gulf Coast of Florida is direct. Louisiana marshes subside at 5 to 25 mm/yr under delta compaction and historic groundwater withdrawal. Houston-Galveston has subsided more than 2 m over the 20th century from groundwater and oil extraction. Any fill project on the Gulf Coast must account for RSLR that is higher than eustatic SLR alone, and must use conservative settlement estimates calibrated to local geology rather than generic defaults.
Rapid intensification and the design-storm problem
The design-storm framework assumes the statistical properties of storms are stationary. The observational record and the attribution literature both indicate this assumption is under pressure.
Globally, extreme rapid intensification events, defined as a 50-knot wind speed increase in 24 hours, have increased significantly from 1990 to 2021. In the North Atlantic, the number of storms rapidly intensifying from Category 1 or weaker to major hurricane more than doubled in 2001 to 2020 compared to the 1971 to 1990 period. Among tropical cyclones causing at least $1 billion in US damage from 1980 to 2024, 70% underwent rapid intensification above the 30-knot-per-24-hour threshold.
Marine heatwaves are a proximate driver. Approximately 70% of hurricanes that formed between 1950 and 2022 were influenced by marine heatwave conditions. Rapid intensification is on average 50% more likely during marine heatwave events (Communications Earth and Environment, 2024). Hurricane Helene in 2024 intensified from Category 1 to Category 4 over the Gulf in approximately 24 hours over a documented marine heatwave; Milton in the same year underwent extreme rapid intensification with winds increasing more than 90 mph in 24 hours, reaching Category 5 at 895 mb before weakening to Category 3 at Siesta Key landfall.
Kossin et al. (2020) found that since 1979, the global likelihood of a tropical cyclone developing into a major hurricane has increased by approximately 5% per decade attributable to human-caused warming.
Knutson (NOAA GFDL) frames the scientific consensus more carefully: greenhouse warming is expected to produce some increase in average hurricane intensity and substantial increase in rainfall near storm centers, but the observational record alone does not yet provide compelling evidence for a century-scale increase in frequency. The intensity signal is stronger and clearer than the frequency signal.
For design purposes, rapid intensification matters because it shortens the warning time available before surge arrives. A storm intensifying from Category 2 to Category 4 in the last 12 to 24 hours before landfall produces significantly more surge than forecast models predicted 48 hours out. Surge barriers with closure times of 30 to 90 minutes must trigger before the surge arrives; they need accurate early forecasts to do so. For reclaimed land designed to a 100-year surge standard, the effective protection level degrades if the real storm distribution has shifted toward higher intensities than the historical record on which the 100-year standard was calibrated.
This is not an argument against the design-storm framework. It is an argument for using the Intermediate-High or High NOAA SLR scenario rather than the Intermediate scenario, and for revisiting design-storm return periods on a decadal basis as the observational record extends.
Elevation design precedent range
The range of finished grades on built and authorized reclamation projects across different wave exposure and SLR planning contexts provides a practical anchor for new design.
| Project | Finished grade | Design basis |
|---|---|---|
| Maasvlakte 2, Rotterdam | +5 m above MSL | North Sea wave exposure; 1,000-year storm standard |
| Lynetteholm, Copenhagen (initial) | +2.5 m above MSL | Baltic RCP8.5 median; adaptable geometry allows future raising to +5.5 m |
| Lynetteholm, Copenhagen (final design) | +5.5 m above MSL | Projected 22nd-century Baltic sea levels |
| Kansai Island 1, Japan (as built) | +4 m above MSL | Design standard before Pleistocene clay settlement was understood |
| Gulf Coast reclamation, worked example | +5.7 m NAVD88 | 100-year surge; NOAA Intermediate SLR; 50-year design life |
| Gulf Coast reclamation, extended life | +6.8 m NAVD88 | 100-year surge; NOAA Intermediate-High SLR; 100-year design life |
The practical range for new reclaimed land on exposed Gulf and Atlantic coasts, accounting for 100-year surge plus wave effects plus NOAA Intermediate SLR, runs from roughly +2.5 m in sheltered low-exposure settings to +5.5 m on open ocean frontage. For critical infrastructure on 100-year design lives, the upper end extends toward +7 m on Gulf Coast locations with significant subsidence history.
The freeboard design connects directly to the coastal-morphodynamics document, which establishes the Sallenger impact scale and the operational goal of keeping the 100-year event in the collision regime rather than the inundation regime. Setting the outer perimeter crest at the design water level plus run-up plus freeboard, and setting interior fill at a lower but still protected elevation, is the standard strategy. The outer dune or seawall absorbs surge energy; the interior fill sits above the residual water level that penetrates the outer defense. The elevation budget for both components comes from the same arithmetic developed here.
Fill method and settlement timeline, which determine how much initial overshooting of target elevation is required to reach design grade after consolidation, are covered in reclamation-methods.
What the arithmetic demands
The central result of this document is practical: a new coastal district on the Gulf Coast of Florida, designed for a 100-year surge, 50-year project life, and NOAA Intermediate SLR, needs a finished grade around +5.7 m NAVD88. Extend the design life to 100 years under Intermediate-High SLR and the requirement approaches +6.8 m. These numbers are achievable with hydraulic fill. Maasvlakte 2 placed 240 million cubic meters of fill to achieve its +5 m standard across 2,000 hectares. The same toolset applies.
What raises the cost is not the elevation requirement but the soil conditions beneath the project. Where Pleistocene clay is deep, thick, and compressible, settlement erodes the freeboard continuously, and the design must either overbuild initially, install adjustable foundations, or plan for periodic re-leveling. Where the seabed is competent, as at Chubu Centrair, the settlement problem is bounded and manageable. Site selection is the first freeboard decision, and it deserves more weight in early planning than it typically receives.
The surge barriers at Rotterdam, Venice, London, and the Zeeland coast demonstrate that when the consequence of flooding is high enough, societies build and maintain structures at the 4,000 to 10,000-year protection level. The Galveston Bay Barrier demonstrates that the United States can authorize such a project. Whether it can fund and build it, at $57 billion over 18 years, is the open question.