Coastal land in Florida carries risk that is quantified, traded, and partially subsidized in ways that matter for any analysis of territorial extension. The price of that risk shapes what land is insurable, who builds on it, and at what standard. Engineered land built to modern specifications occupies a different position in these pricing structures than legacy development on sites that predate current codes. Understanding where the two diverge requires working through the mechanics of catastrophe modeling, the Florida insurance market, and the risk transfer instruments that sit above it.
How the industry quantifies hurricane loss
Catastrophe modeling as a commercial discipline emerged after Hurricane Andrew in 1992, which produced roughly $27 billion in insured losses and bankrupted several carriers. The industry’s response was to build probabilistic simulation systems capable of generating full loss distributions before events, not relying on historical averages.
Two firms established the foundation. AIR Worldwide, founded in 1987 and now part of Verisk Analytics, and Risk Management Solutions (RMS), now part of Moody’s following a 2021 acquisition for approximately $2 billion, built the first systems that combined meteorology, structural engineering, and financial loss calculations into a usable actuarial tool. A key early innovation was embedding reinsurance financial structures into the loss computation so that primary and reinsurance pricing could be derived from a single model run. Moody’s states that 10 of the top 10 reinsurance brokers and 9 of the top 10 commercial insurers use its platform (Moody’s RMS, current).
Karen Clark and Company (KCC) is the principal independent challenger, founded by Karen Clark, who co-founded AIR. KCC’s hurricane analysis includes a climate adjustment attributing approximately 11% higher insured losses since 1900 to climate effects (KCC, 2024). KCC’s $63 billion estimate for Hurricane Ian explicitly incorporated demand surge and litigation load, producing the high end of the post-event range.
The four-component architecture
All major commercial cat models share a four-component structure. The implementation within each component is where model differentiation occurs.
Hazard module. For hurricane models, the hazard module generates synthetic storm catalogs, typically 10,000 to 100,000 years of simulated Atlantic hurricane activity, parameterized by historical track data, NOAA HURDAT2 records, and climate drivers. Wind fields are computed from track parameters using Holland or similar parametric models, then modified by terrain roughness and inland decay. Storm surge computation requires coupling of wind fields to hydrodynamic surge models, typically ADCIRC-type or proprietary equivalents, that propagate surge inundation based on bathymetry, topography, and barrier geometry.
Vulnerability module. The vulnerability module specifies damage functions: for each building type and hazard intensity, what fraction of replacement value is destroyed. Inputs include construction type, roof shape and deck attachment, opening protection, year built, and occupancy class. Post-event recalibration is continuous. After Ian (2022), Moody’s RMS recalibrated vulnerability upward for condominium HOA common areas and light commercial structures, which performed significantly worse than pre-Ian models anticipated (Amwins, 2024). This produced increased expected annual losses and 100-year return-period losses for portfolios with commercial-residential exposure.
Exposure module. The exposure database specifies what is at risk: geocoded location, replacement cost value, construction type, year built, occupancy, and policy conditions. Exposure quality is the largest source of epistemic uncertainty in any given model run. Missing or misclassified exposure can produce multi-billion-dollar errors at portfolio scale.
Financial engine. The financial engine translates expected physical damage into insured loss under policy terms, applying coverage limits, deductibles, coinsurance, aggregate caps, and the full reinsurance tower structure. This capability was central to the original competitive position of AIR and RMS.
Model uncertainty at the tails
A 2017 analysis by Weinkle and Pielke examined five cat model vendors and found that the 95% confidence interval for the 100-year Florida hurricane wind loss event spanned $33 billion to $192 billion, a factor-of-six range (Weinkle and Pielke, 2017). Hurricane Ian, a realized major event, generated estimates ranging from $53 billion (Verisk low end) to $74 billion (Moody’s RMS high end), with KCC at $63 billion and Munich Re at $60 billion (Swiss Re Capital Markets, 2022). The spread across Ian estimates approached $21 billion on a single historical event, consistent with the Weinkle-Pielke confidence band.
The divergence is widest on rate view. Moody’s RMS Medium-Term Rate conditions stochastic storm catalogs on current-period climate drivers, specifically high sea surface temperatures and low Atlantic Multidecadal Oscillation, projecting elevated near-term expected losses compared to a long-run historical average. Verisk’s Climate Conditioned View offers a warm-SST catalog alongside a long-term historical view. The spread between a current-climate and historical-stationarity view can shift a 100-year return period loss estimate by 15-30% for a Florida coastal portfolio, depending on the model year and parameter choices.
The flood gap and its partial closure
Katrina (2005) exposed the dominant shortcoming of commercial cat models: wind-focused tools treated flood and surge as secondary or excluded. Katrina’s dominant damage mechanism was storm surge, not wind. The “model wars” of 2005-2006 saw both AIR and RMS release updated Atlantic hurricane models with significantly higher projected frequency and intensity following the active 2004-2005 seasons, driving 2006 reinsurance rate hardening. The divergence between the vendors’ updated catalogs became public, establishing model uncertainty as a first-order pricing variable.
The flood gap narrowed after Katrina with greater integration of ADCIRC-based surge modeling and the eventual development of the probabilistic flood model used in NFIP Risk Rating 2.0. Ian’s 2022 coastal surge damage in Fort Myers Beach and neighboring communities substantially exceeded preliminary model estimates, demonstrating residual underrepresentation even in recalibrated tools (NHC TCR AL092022).
Florida Public Hurricane Loss Model
The Florida Public Hurricane Loss Model (FPHLM) was commissioned by the Florida Office of Insurance Regulation and developed by a consortium led by Florida International University, including Florida Institute of Technology, Florida State University, University of Florida, University of Miami, NOAA Hurricane Research Division, and others. The Florida Commission on Hurricane Loss Projection Methodology certified the FPHLM in 2007, 2008, 2009, 2011, and 2013 (FIU/IHRC, current).
FPHLM follows a three-component architecture: atmospheric, vulnerability, and actuarial. The actuarial component translates physical damage to insured loss costs and probable maximum loss by coverage type for personal lines and commercial residential lines. Its key distinction is open methodology subject to public scrutiny, developed without industry funding, designed specifically so that OIR can justify accepting or rejecting rate increase filings against an objective baseline rather than relying solely on proprietary vendor outputs. FPHLM does not embed full reinsurance tower structures and is used for rate certification rather than reinsurance pricing.
A 2022 analysis in the Journal of Catastrophe Risk and Resilience comparing seven flood models found that the three models used in NFIP Risk Rating 2.0 pricing (Verisk, KatRisk, Moody’s RMS) achieved a 4% differential vs. historical NFIP claims data; FPHLM performed within comparable range for Florida residential wind losses in validation studies.
Climate-conditioned views
Regulators, rating agencies, and institutional investors increasingly require forward-looking loss estimates that condition on climate trajectories rather than historical stationarity.
Moody’s RMS ClimaticMetrics projects hurricane frequency and intensity under IPCC scenarios through 2100, offering loss distributions conditional on 1.5°C, 2°C, and higher warming pathways. Verisk provides scenario-conditioned loss projections complementing its warm-SST historical catalog. Both update hazard and vulnerability continuously after major events; a model version used to price a multi-year reinsurance treaty may differ materially from the current version.
The science underlying these updates is directionally consistent. Globally, extreme rapid intensification events (50 knots in 24 hours) increased significantly from 1990 to 2021, linked to warming sea surface temperatures. In the North Atlantic, storms rapidly intensifying from Category 1 or weaker to major hurricane more than doubled in 2001-2020 compared to 1971-1990 (Climate Central, 2023). Rapid intensification is on average 50% more likely during marine heatwave conditions (Communications Earth and Environment, 2024). Of 63 tropical cyclones causing at least $1 billion in US damage from 1980 to July 2024, 44, or 70%, underwent rapid intensification.
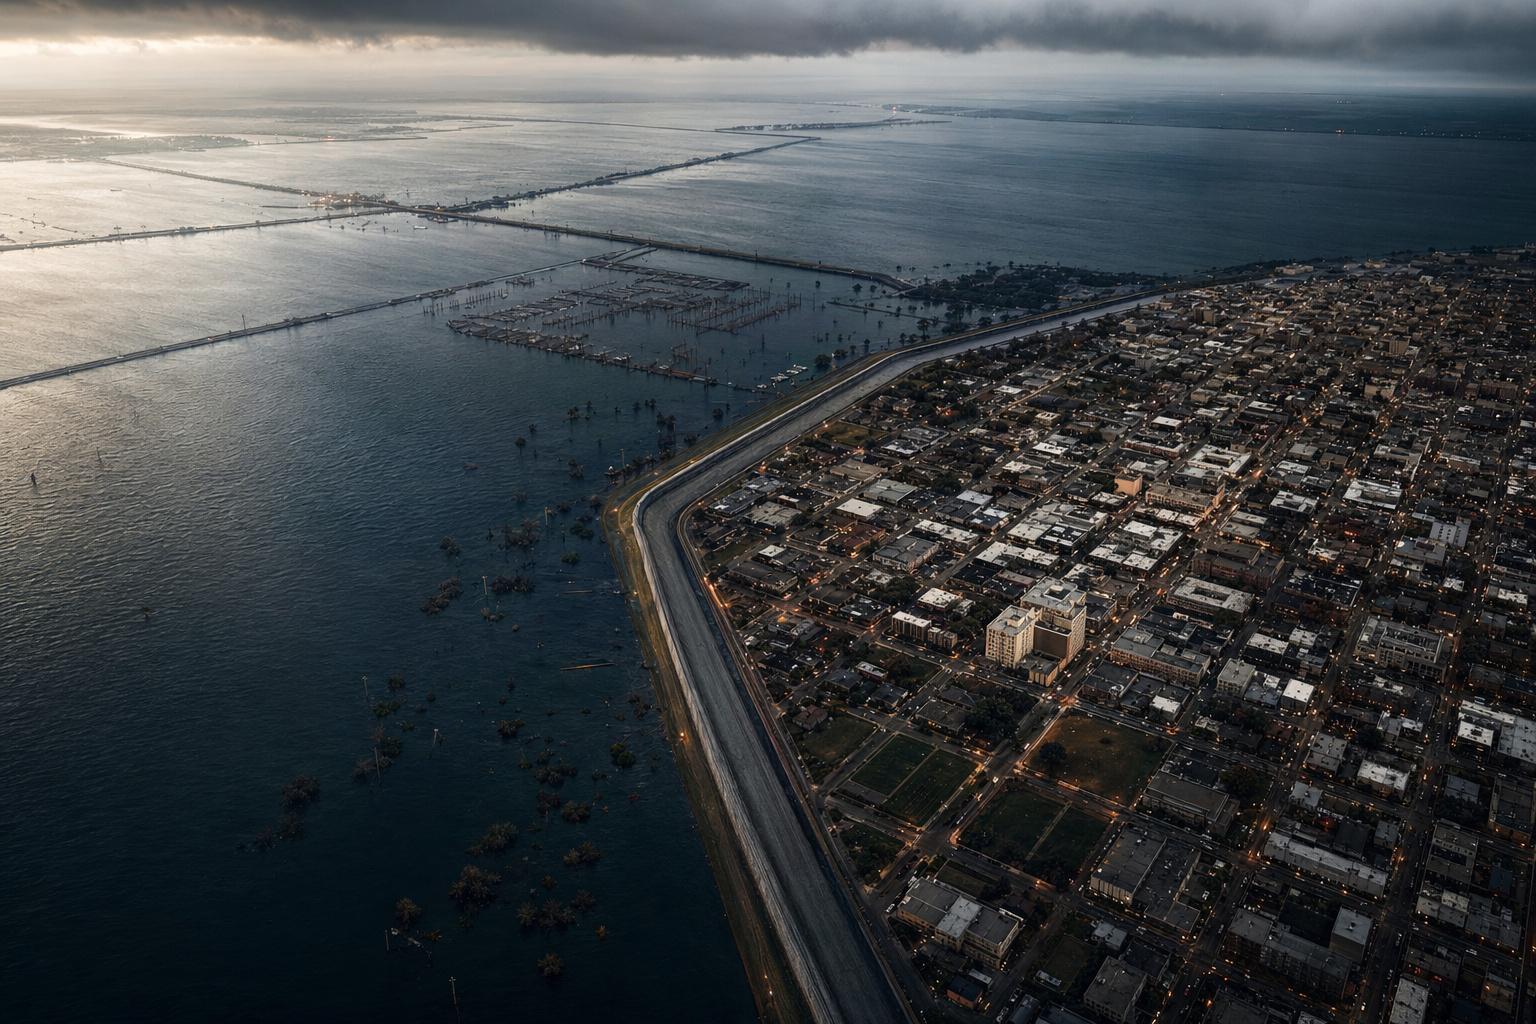
For Florida specifically, Florida accounts for 30-50% of US insured catastrophe hurricane loss potential in industry models. A repeat of the 1926 Great Miami Hurricane (comparable to a Category 4-5 direct Miami track) is estimated to cause $100 billion or more in insured losses at today’s exposure levels.
ILS, cat bonds, and parametric triggers
The insurance-linked securities market developed from the mid-1990s as a mechanism to transfer catastrophe risk to capital markets rather than concentrating it on reinsurance balance sheets. The market outstanding reached $49.5 billion at end-2024, with $17.7 billion issued in 2024 alone, both records (Risk and Insurance, 2024). The broader ILS market, including collateralized reinsurance and sidecars, reached approximately $107-110 billion in capacity by end-2024.
Cat bond investors earned average returns of 19.69% in 2023 and 17.29% in 2024, driven by elevated spreads post-Ian and below-average loss activity (Artemis.bm, 2024). Cat bond spreads widened approximately 50% in Q4 2022 following Ian, reflecting the market repricing Florida hurricane risk after a realized major loss.
Industry loss warranties (ILWs) pay when a publicly reported industry loss index exceeds a trigger threshold. A Florida wind ILW might trigger at $30 billion industry insured loss from a named storm. The cedent receives a fixed payout regardless of their specific losses. ILWs eliminate basis risk for the industry aggregate but leave the cedent exposed to idiosyncratic portfolio differences vs. the index.
Parametric cat bonds pay based on physical event parameters: wind speed at specified stations, earthquake ground acceleration, or storm central pressure. The 2024 Beryl example illustrates basis risk: the storm struck the Caribbean but did not reach the minimum central pressure threshold in covered-area bonds, producing no payout despite significant losses. Parametric structures represented approximately 7% of issuance in H1 2024 by volume, up from 6.2% in H1 2023; indemnity structures retain dominant share (Artemis/AM Best, 2024).
Citizens Property Insurance Corporation and several Florida domestic carriers use cat bonds alongside traditional reinsurance to build risk transfer towers. Citizens’ 2025 planned tower was approximately $4.5 billion combining traditional reinsurance and cat bonds; its 2024 private reinsurance purchase was $3.6 billion after finding the full $5.5 billion target too expensive at prevailing prices (Artemis.bm, 2025).
Florida’s insurance market: 2022-2026
Florida’s property insurance market entered systemic crisis in 2022 after a decade of litigation-driven loss accumulation. The state represented roughly 7% of US property insurance claims but generated an estimated 74% of all US property insurance lawsuits. That ratio, compounding for years, overloaded domestic carriers before Ian arrived.
Insolvencies
Six Florida-domiciled carriers were declared insolvent during 2022; a seventh followed in early 2023. All entered receivership under the Second Judicial Circuit Court in Leon County, with the Florida Department of Financial Services as receiver.
| Company | Liquidation Date | NAIC # |
|---|---|---|
| St. Johns Insurance Company | Feb 25, 2022 | 11844 |
| Avatar Property and Casualty | Mar 14, 2022 | 13139 |
| Southern Fidelity Insurance | Jun 15, 2022 | 10136 |
| Weston Property and Casualty | Aug 8, 2022 | 11853 |
| Lighthouse Property Insurance | Fall 2022 | — |
| FedNat Insurance Company | Sep 27, 2022 | 10790 |
| United Property and Casualty (UPCIC) | Feb 27, 2023 | 10969 |
FedNat reached receivership with a stated $140 million-plus reserve gap. UPCIC’s insolvency report attributed failure to a $140 million Hurricane Ian reserve deficiency compounding multi-year surplus erosion from litigated claims (Florida DFS, live registry).
The Florida Insurance Guaranty Association covered claims from 10 insolvencies since 2019 involving 440,000 policies at a total cost approaching $1.6 billion, levying emergency assessments of 1.3% and 0.7% simultaneously in parts of this period.
Beyond insolvencies, State Farm, Allstate, Farmers, Lexington Insurance (AIG subsidiary), and Progressive all reduced or exited Florida exposure in this period.
Citizens policy count
Citizens Property Insurance Corporation, the state’s insurer of last resort, absorbed the displaced market.
| Date | Policy Count |
|---|---|
| Early 2021 | approximately 500,000 |
| Sep 2022 | 1,055,000 |
| Oct 2023 | 1,420,000 (peak) |
| Jan 2024 | 1,177,862 |
| Early 2026 | approximately 336,000 |
Citizens’ spring 2023 market share reached approximately 19% of homeowners policies statewide. The OIR approved 768,692 policy assumptions in 2024 alone, an 858% increase over 2022, as the post-reform market depopulation accelerated. By early 2026, Citizens held approximately 336,000 policies, 76% below its October 2023 peak.
FHCF mechanics
The Florida Hurricane Catastrophe Fund, established after Andrew in 1993, provides tax-exempt reimbursement to private insurers and Citizens. It functions as a public reinsurance layer backed by assessments and pre-event bonding authority. The FHCF mandatory layer for Citizens was approximately $5.02 billion in 2024, projected at $3.548 billion for 2025 as depopulation reduced exposure. The FHCF adds a statutory 25% rapid cash buildup factor to its premium; Citizens must pass this cost to policyholders outside the general rate glide path cap.
Reinsurance rate cycle
| Year | Market Direction | Key Movement |
|---|---|---|
| 2022 | Hardening (post-Ian) | Capacity compressed; programs placed at wire |
| 2023 | Hard | Florida reinsurance cost up approximately 27%; cat bond spreads up 50% in Q4 2022 |
| 2024 | First softening | Risk-adjusted reinsurance cost decreased average -1.7% per OIR data call |
| 2025-2026 | Continued easing | ILS flows returned; 12 new entrants approved |
Swiss Re reported total global natural catastrophe insured losses of $115 billion for 2022 against a 10-year average of $81 billion, with Ian ranking as the second-largest single insured loss event on record after Katrina (Swiss Re, Dec 2022). Reinsurers cited Florida’s litigation environment alongside physical storm risk as dual drivers of attachment point increases and withdrawal from working-layer coverage.
Legislative reforms
SB 2-A (December 16, 2022) was the central reform. Governor DeSantis signed it after a special session; the House voted 84-33, Senate 27-13. Key provisions: elimination of one-way attorney fees under Florida Statutes §§627.428, 626.9373, and 627.70152 for residential and commercial property insurance suits; prohibition of post-loss benefit assignment (AOB) for policies issued on or after January 1, 2023; bad faith actions restricted to situations where an insurance contract has been breached; claims filing period shortened from two years to one year; $1 billion in subsidized reinsurance appropriated for private carriers through the FHCF mechanism (Clyde and Co., 2023; Florida Senate, 2022).
HB 837 (2023) was a broader civil tort reform affecting property insurance through modified comparative fault standards, a shorter statute of limitations, and further litigation practice restrictions.
Reform outcomes by the numbers: litigation declined 36% from the 2021 peak; 23% from 2023 to 2024; 25% in H1 2025 vs. H1 2024. Loss reserve development fell 44.8% from 2022 to 2023 ($772 million to $398 million at 2-year look-back) (OIR, April 2024).
Six of ten national carriers operating in Florida expanded their Florida book in 2024; four filed for rate decreases. OIR approved 12 new company entrants since the 2022 reforms.
HCI Group as market signal
HCI Group (HCPCI and TypTap) reported Q4 2024 gross premiums of $297.5 million, 38% year-over-year growth, driven primarily by Citizens policy assumptions. The gross loss ratio ran below 25% in 2024; the normalized combined ratio was approximately 75%; surplus exceeded $500 million; market cap reached approximately $2.1 billion by early 2026 (Insurance Journal, 2024). Consecutive 2024 hurricanes (Helene, Milton) generated 22,600 claims and expected payments of $500 million but did not breach catastrophe reinsurance towers for well-reserved carriers.
NFIP Risk Rating 2.0
FEMA implemented Risk Rating 2.0 in phases, with full implementation effective April 1, 2023. The new methodology replaces flood-zone-based pricing with property-specific variables: distance from water, flood type, flood frequency, foundation type, lowest floor elevation relative to base flood elevation, prior claims history, and structure replacement cost value.
Florida holds the largest state book in the NFIP: 1.7 million policies covering approximately $440 billion in structures (FEMA Florida State Profile, April 2025). FEMA’s analysis projected 80% or more of Florida policies would face premium increases under the new methodology. The current average Florida flood premium is approximately $958 per year, ranging from approximately $400 in low-risk zones to $12,000 or more for coastal high-hazard properties.
Statutory caps constrain transition speed: 18% annual increases for primary residences; 25% for non-primary residences, business properties, and severe repetitive loss properties. At those cap rates, the GAO estimated that 95% of policies would reach full-risk rates by approximately 2037, representing a $27 billion cumulative premium shortfall. The NFIP currently carries approximately $25 billion in debt to the US Treasury following post-Katrina and post-Sandy payouts.
The transition matters for territorial engineering because NFIP pricing is where many coastal property owners first encounter the actuarial cost of their location. Risk Rating 2.0 makes that cost property-specific rather than zone-averaged, which widens the spread between well-sited and poorly-sited coastal land.
Building codes and the pricing of engineered land
Cat models explicitly stratify construction quality by permit date relative to the 2002 Florida Building Code effective date (March 1, 2002 statewide) and the 1994 South Florida Building Code effective date (September 1, 1994, applicable to the High Velocity Hurricane Zone). Post-FBC construction receives lower damage functions, capturing the measurable reduction from improved roof deck attachment, secondary water resistance, and opening protection requirements.
The HVHZ designation applies to Miami-Dade County (175 mph Risk Category II design wind speed, 700-year mean return interval) and Broward County (175-180 mph coastal, 155-165 mph inland) under the Florida Building Code 8th Edition (2023). The HVHZ is the only region in the United States requiring impact resistance of the entire building envelope, not just glazed openings. Exposure Category C is mandatory throughout.
Wind mitigation discounts required under Florida Statute §627.0629 can reach up to 88% of the windstorm premium component. Opening protection is effectively binary: one unprotected opening eliminates the discount category. The practical consequence is that the gap in expected annual loss between pre-FBC and post-FBC coastal construction is large enough to substantially affect insurance premiums over a policy’s lifetime, which in turn affects the market value of the underlying land.
New land built to post-FBC specification with current design standards occupies the favorable end of this spread by construction. The question for florida-case-study is whether that favorable position is durable or whether it erodes as insurers reassess the coastal risk signal over time.
How international models handle coastal flood risk
Two foreign public-private structures provide contrast with the US approach.
The Netherlands operates a mandatory national flood insurance scheme administered through private insurers. Policyholders in flood-risk areas receive coverage as part of standard home insurance without separate flood policy purchase, with government reinsurance capacity backstopping extreme tail events. The insurance market therefore prices on top of an assumption that primary flood defenses work, reflected in the 10,000-year return period standard for the Maeslantkering (Rotterdam) and Delta Works barriers (storm-surge-and-sea-level). This creates a co-dependency between defense investment and insurance pricing: better defenses permit lower premiums, which makes the defense investment economically legible to the market.
Singapore combines mandatory flood insurance within standard building policies in flood-designated zones with a building control regime that requires properties in at-risk areas to incorporate flood barriers. The Building and Construction Authority sets minimum platform levels for new development; JTC-administered industrial estates on reclaimed land specify site elevations and freeboard explicitly in lease terms. The result is that the public entity controlling the land supply also controls the engineering standard, which is then reflected in insurance requirements and pricing.
Both models differ from the US primarily in the integration point. In the Netherlands and Singapore, the public entity sets the defense standard, and insurance pricing adapts to it. In Florida, insurance pricing responds to the revealed risk on a property-by-property basis, while defense investment and land use regulation proceed through separate and slower-moving processes. NFIP Risk Rating 2.0 is a partial step toward property-specific pricing, but it operates without a coordinated defense investment counterpart.
For reclaimed land, the institutional design question is which model applies. Land built under public-entity ownership (a Battery Park City Authority analog, or a JTC-type structure) can set engineering standards that are incorporated into ground lease terms, making the connection between construction quality and insurance cost explicit at the point of land sale. That approach is closer to the Singapore model. Legacy coastal land in Florida operates closer to the US default: property-specific pricing with no coordinated defense investment signal. The implications for economics and value capture are in economics-and-value-capture.
Risk pricing for engineered vs. legacy land
Cat models generate loss estimates for individual properties and portfolios based on the exposure inputs they receive. The key inputs that differentiate new coastal land from legacy coastal land are construction date, construction type, elevation, and distance from water.
New land built under current design standards holds advantages across multiple input categories simultaneously. Construction is post-FBC (2002 or later) with HVHZ compliance if in Miami-Dade or Broward. Elevation is set by design, incorporating NOAA Intermediate-High sea-level-rise scenarios (1.5 m by 2100) and freeboard for design-storm surge. The storm-surge-and-sea-level document covers the design-grade calculations; for Gulf Coast new construction with a 50-year project life, minimum finished grade works out to approximately 5.7 m NAVD88.
Legacy coastal land in Florida presents the opposite profile. Older construction in Miami-Dade and Broward that predates SFBC-94 (September 1, 1994) carries damage functions significantly above the post-code baseline. Structures with unprotected openings, weak roof deck attachment, or inadequate secondary water resistance drive expected annual losses materially higher. At the zip-code level, the difference in expected annual loss between pre- and post-code construction in coastal HVHZ areas can exceed a factor of two.
The insurability gap that has opened in coastal Florida since 2022 is partly a physical risk story and partly a litigation and litigation-cost story. SB 2-A addressed the litigation cost component directly. The physical risk component is addressed only through building code and NFIP pricing. Risk Rating 2.0 begins to surface the full physical risk signal at the property level, which will widen the price spread between the two land types over the 2025-2037 transition period as policies approach full-risk rates.
For the territorial engineering question: new land built to current specification starts on the favorable side of this spread. It avoids the transition cost that legacy properties face as NFIP prices converge toward actuarial rates. It is also insurable in the private market at a predictable underwriting basis, which matters for the debt financing of development on that land. The relevant downstream document is economics-and-value-capture, which covers how that pricing advantage translates into land value and development feasibility.
The limitation is that favorable initial pricing does not guarantee long-term insurability if climate-conditioned loss estimates continue to rise. Cat model vendors are updating climate views continuously. A 15-30% upward shift in expected annual loss from current-climate conditioning versus historical stationarity applies to all coastal land in Florida, new or legacy, unless physical defenses reduce the hazard for the specific site. The connection between layered barrier topology and site-level hazard reduction is in storm-surge-and-sea-level.
What the numbers establish
The catastrophe modeling industry produces a 95% confidence interval of $33 billion to $192 billion for the 100-year Florida hurricane loss event, a factor-of-six range that is structural rather than a near-term refinement problem (Weinkle and Pielke, 2017). Ian realized at $53-74 billion insured, which falls within that band but confirms the spread is operational, not theoretical.
Florida’s insurance market went from systemic crisis in 2022, seven carrier insolvencies, 1.42 million Citizens policies at peak, and 27% reinsurance cost increases, to meaningful stabilization by 2025, Citizens at 336,000, the first reinsurance cost decrease in years, and 12 new market entrants. The stabilization was produced by legislative reform (SB 2-A, HB 837) rather than any change in physical risk. Physical risk has, if anything, increased: the 2024 hurricane season demonstrated continued rapid intensification under Gulf marine heatwave conditions.
NFIP Risk Rating 2.0 will price 1.7 million Florida flood policies toward actuarial rates over the 2025-2037 window, surfacing costs that have been subsidized through zone-averaged pricing for decades. That transition affects the economic calculus of coastal development, and it affects it differently for engineered land (which starts at a favorable actuarial position) than for legacy land (which faces the transition cost in full).
The ILS market has demonstrated appetite for Florida cat risk at the right price: $49.5 billion in outstanding cat bonds, record issuance in 2024, and 19-17% investor returns in 2023-2024 show that capital markets can absorb the risk. The pricing question is whether the actuarial cost of coastal occupancy can be borne by the land value it generates. For high-density engineered land on new frontage, the economics depend on the value capture structure, covered in economics-and-value-capture. For existing coastal Florida development, the test is whether reform-era carrier returns persist through the next major event cycle.